
Winter Arctic sea ice from IS2SMGPSIT-V1 (updates through April 2026)#
Summary: Winter (November–April) mean maps and multi-winter anomaly maps of sea ice thickness, freeboard, and snow depth from a new daily fused ICESat-2–SMOS/SMAP product, now including the 2025–2026 growth season. Map layout follows notebook 11e, extended to eight winters. The V1 dataset has been submitted to peer review at ESSD, this notebook showcases an additional winter of data using that same processing.
Author: Alek Petty
Version history: Version 1 (09/2026)
### Import notebook dependencies

import xarray as xr
import numpy as np
import pandas as pd
import matplotlib as mpl
import warnings

from utils.read_data_utils import read_is2smgpsitv1_zarr
from utils.plotting_utils import (
    staticArcticMaps_equal_panels,
    compute_gridcell_winter_means,
    static_winter_comparison_lineplot,
)

mpl.rcParams['figure.dpi'] = 200
warnings.filterwarnings('ignore')
# Set some plotting parameters
mpl.rcParams.update({
    "text.usetex": False,
    "font.family": "sans-serif",
    "mathtext.fontset": "stixsans",
    "lines.linewidth": 1.0,
    "font.size": 8,
    "axes.labelsize": 8,
    "xtick.labelsize": 8,
    "ytick.labelsize": 8,
    "legend.fontsize": 8,
})
mpl.rcParams['font.sans-serif'] = ['Helvetica Neue', 'Helvetica', 'Arial', 'DejaVu Sans']
Load IS2SMGPSIT-V1 through April 2026#
The published v0.1 store ends on 30 April 2025. The 2025–2026 season is a separate Zarr under dev_v7_26. Concatenate the two daily stores, then resample to monthly means so compute_gridcell_winter_means can build November–April winters.
%%time
ZARR_V1 = (
    's3://icesat-2-sea-ice-us-west-2/is2smsitgp/dev_v7/zarr/'
    'GPSat_multivar_20181101-20250430.zarr'
)
ZARR_2026 = (
    's3://icesat-2-sea-ice-us-west-2/is2smsitgp/dev_v7_26/zarr/'
    'GPSat_multivar_20250901-20260430.zarr'
)

ds_v1 = read_is2smgpsitv1_zarr(zarr_path=ZARR_V1, load_cache=True, persist=False)
ds_26 = read_is2smgpsitv1_zarr(zarr_path=ZARR_2026, load_cache=True, persist=False)
IS2_SMOS_SMAP = xr.concat([ds_v1, ds_26], dim='time').sortby('time')
print(IS2_SMOS_SMAP)
print('time range:', IS2_SMOS_SMAP.time.values.min(), '→', IS2_SMOS_SMAP.time.values.max())
Loading IS2-SMOS-SMAP (is2smsitgp) Zarr from local cache
cache_path: ./data/cache/GPSat_multivar_20181101-20250430.zarr
Loading IS2-SMOS-SMAP (is2smsitgp) Zarr from local cache
cache_path: ./data/cache/GPSat_multivar_20250901-20260430.zarr
<xarray.Dataset> Size: 6GB
Dimensions:                             (time: 1877, y: 448, x: 304)
Coordinates:
    latitude                            (y, x) float32 545kB 31.1 31.2 ... 34.47
    longitude                           (y, x) float32 545kB 168.3 ... -9.999
  * time                                (time) datetime64[ns] 15kB 2018-11-01...
  * x                                   (x) float32 1kB -3.838e+06 ... 3.738e+06
  * y                                   (y) float32 2kB 5.838e+06 ... -5.338e+06
Data variables: (12/13)
    crs                                 (time) int32 8kB dask.array<chunksize=(93,), meta=np.ndarray>
    freeboard                           (time, y, x) float32 1GB dask.array<chunksize=(93, 448, 304), meta=np.ndarray>
    grid_cell_area                      (time, y, x) float32 1GB dask.array<chunksize=(938, 448, 304), meta=np.ndarray>
    ice_thickness                       (time, y, x) float32 1GB dask.array<chunksize=(93, 448, 304), meta=np.ndarray>
    ice_thickness_unc                   (time, y, x) float32 1GB dask.array<chunksize=(93, 448, 304), meta=np.ndarray>
    mean_freeboard_regions_1_5          (time) float32 8kB dask.array<chunksize=(93,), meta=np.ndarray>
    ...                                  ...
    mean_sea_ice_thickness_regions_1_5  (time) float32 8kB dask.array<chunksize=(93,), meta=np.ndarray>
    mean_snow_depth_regions_1_5         (time) float32 8kB dask.array<chunksize=(93,), meta=np.ndarray>
    region_mask                         (time, y, x) float32 1GB dask.array<chunksize=(938, 448, 304), meta=np.ndarray>
    snow_depth                          (time, y, x) float32 1GB dask.array<chunksize=(93, 448, 304), meta=np.ndarray>
    total_sea_ice_volume                (time) float32 8kB dask.array<chunksize=(93,), meta=np.ndarray>
    total_sea_ice_volume_regions_1_5    (time) float32 8kB dask.array<chunksize=(93,), meta=np.ndarray>
Attributes:
    caa_uncertainty_caution:    Canadian Arctic Archipelago (CAA; NSIDC-0780 ...
    contact:                    Alek Petty (akpetty@umd.edu)
    description:                ICESat-2–SMOS–SMAP fused daily gridded produc...
    history:                    Created 2026-07-29
    inner_arctic_regions_note:  Inner-Arctic scalars (mean_*_regions_1_5, tot...
    n_timesteps:                1635
    source:                     Combined from monthly IS2_interp_test_petty f...
    time_coverage_end:          2025-04-30
    time_coverage_start:        2018-11-01
    training_season_caution:    GP training is limited to a seasonal window (...
time range: 2018-11-01T00:00:00.000000000 → 2026-04-30T00:00:00.000000000
CPU times: user 1.47 s, sys: 724 ms, total: 2.2 s
Wall time: 811 ms
# Monthly means (month-start labels) for winter aggregation / map plotting
IS2_monthly = IS2_SMOS_SMAP[['ice_thickness', 'freeboard', 'snow_depth']].resample(time='1MS').mean()
IS2_monthly = IS2_monthly.assign_coords(
    latitude=IS2_SMOS_SMAP.latitude,
    longitude=IS2_SMOS_SMAP.longitude,
)
print(IS2_monthly)
print('monthly times:', IS2_monthly.time.values[0], '→', IS2_monthly.time.values[-1],
      f'({IS2_monthly.sizes["time"]} months)')
<xarray.Dataset> Size: 148MB
Dimensions:        (x: 304, y: 448, time: 90)
Coordinates:
  * x              (x) float32 1kB -3.838e+06 -3.812e+06 ... 3.712e+06 3.738e+06
  * y              (y) float32 2kB 5.838e+06 5.812e+06 ... -5.312e+06 -5.338e+06
  * time           (time) datetime64[ns] 720B 2018-11-01 ... 2026-04-01
    latitude       (y, x) float32 545kB 31.1 31.2 31.3 ... 34.68 34.58 34.47
    longitude      (y, x) float32 545kB 168.3 168.1 168.0 ... -10.18 -9.999
Data variables:
    ice_thickness  (time, y, x) float32 49MB dask.array<chunksize=(1, 448, 304), meta=np.ndarray>
    freeboard      (time, y, x) float32 49MB dask.array<chunksize=(1, 448, 304), meta=np.ndarray>
    snow_depth     (time, y, x) float32 49MB dask.array<chunksize=(1, 448, 304), meta=np.ndarray>
Attributes:
    caa_uncertainty_caution:    Canadian Arctic Archipelago (CAA; NSIDC-0780 ...
    contact:                    Alek Petty (akpetty@umd.edu)
    description:                ICESat-2–SMOS–SMAP fused daily gridded produc...
    history:                    Created 2026-07-29
    inner_arctic_regions_note:  Inner-Arctic scalars (mean_*_regions_1_5, tot...
    n_timesteps:                1635
    source:                     Combined from monthly IS2_interp_test_petty f...
    time_coverage_end:          2025-04-30
    time_coverage_start:        2018-11-01
    training_season_caution:    GP training is limited to a seasonal window (...
monthly times: 2018-11-01T00:00:00.000000000 → 2026-04-01T00:00:00.000000000 (90 months)
Winter mean maps#
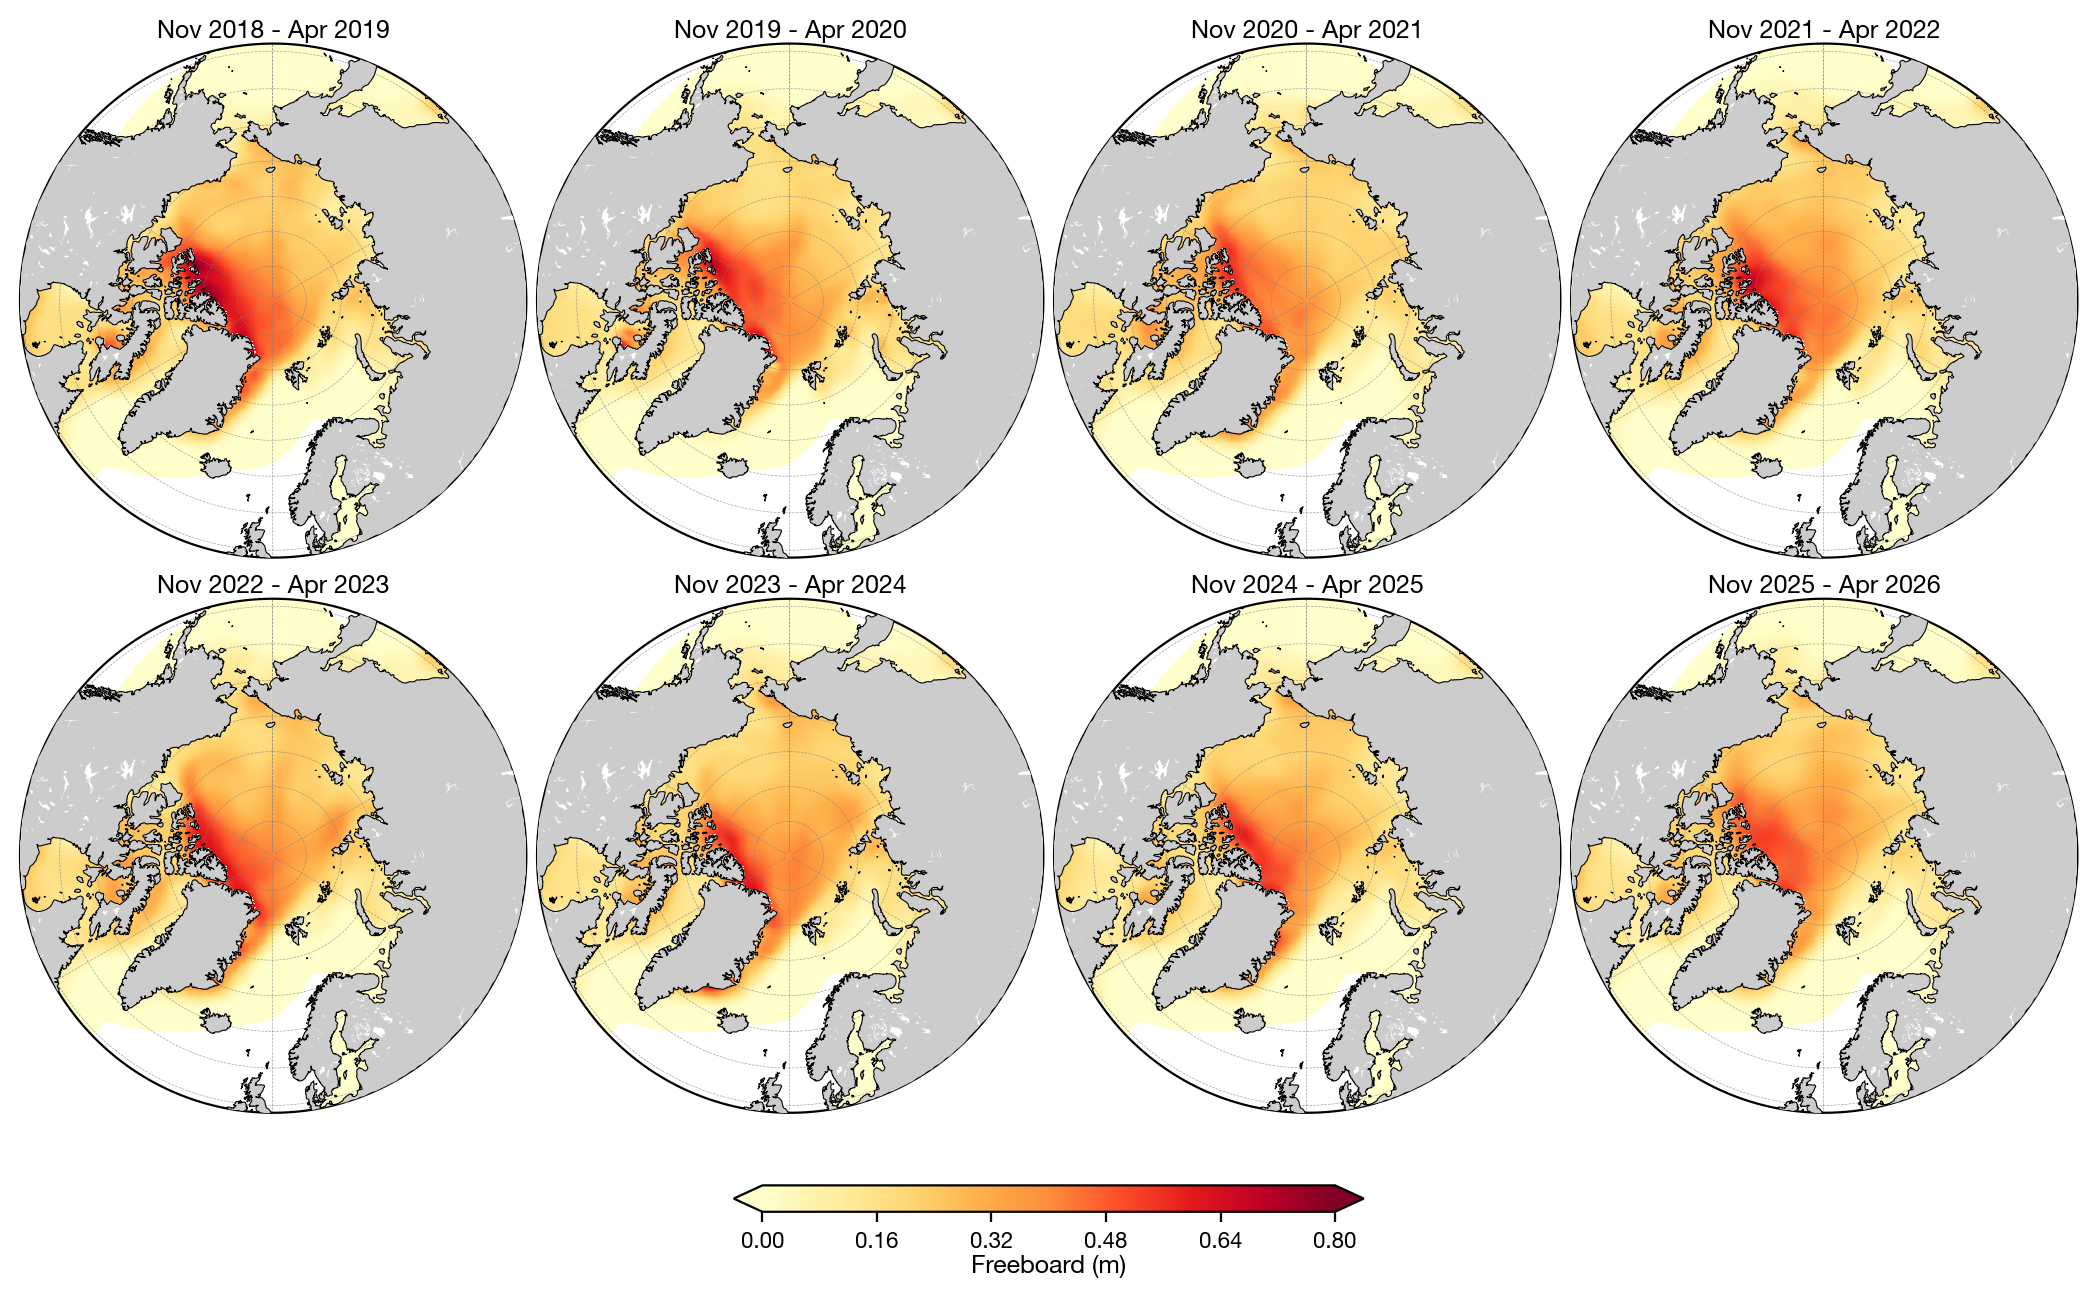
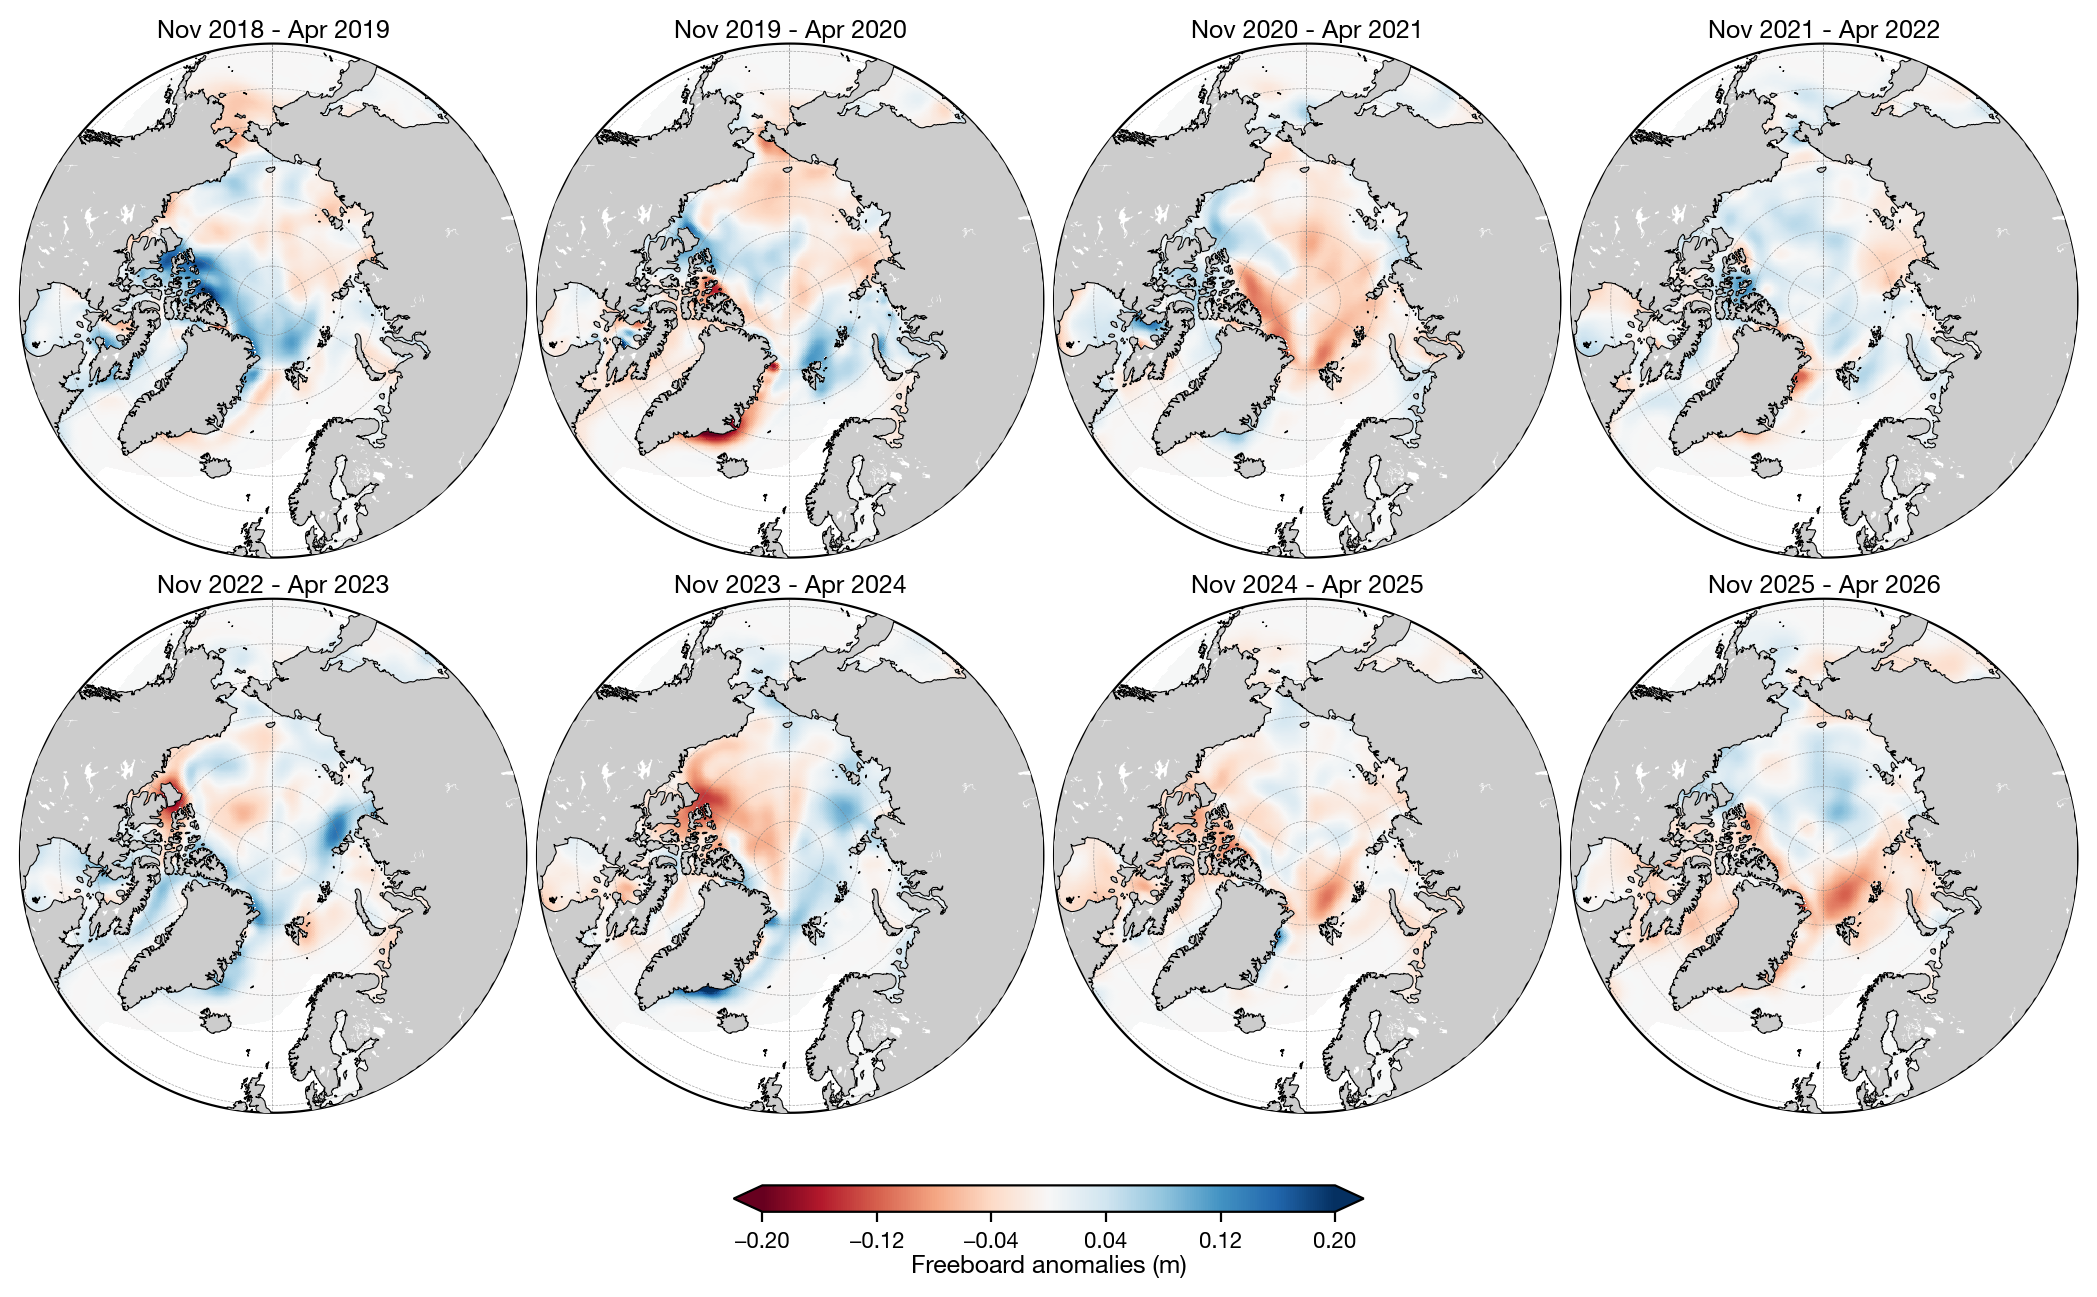
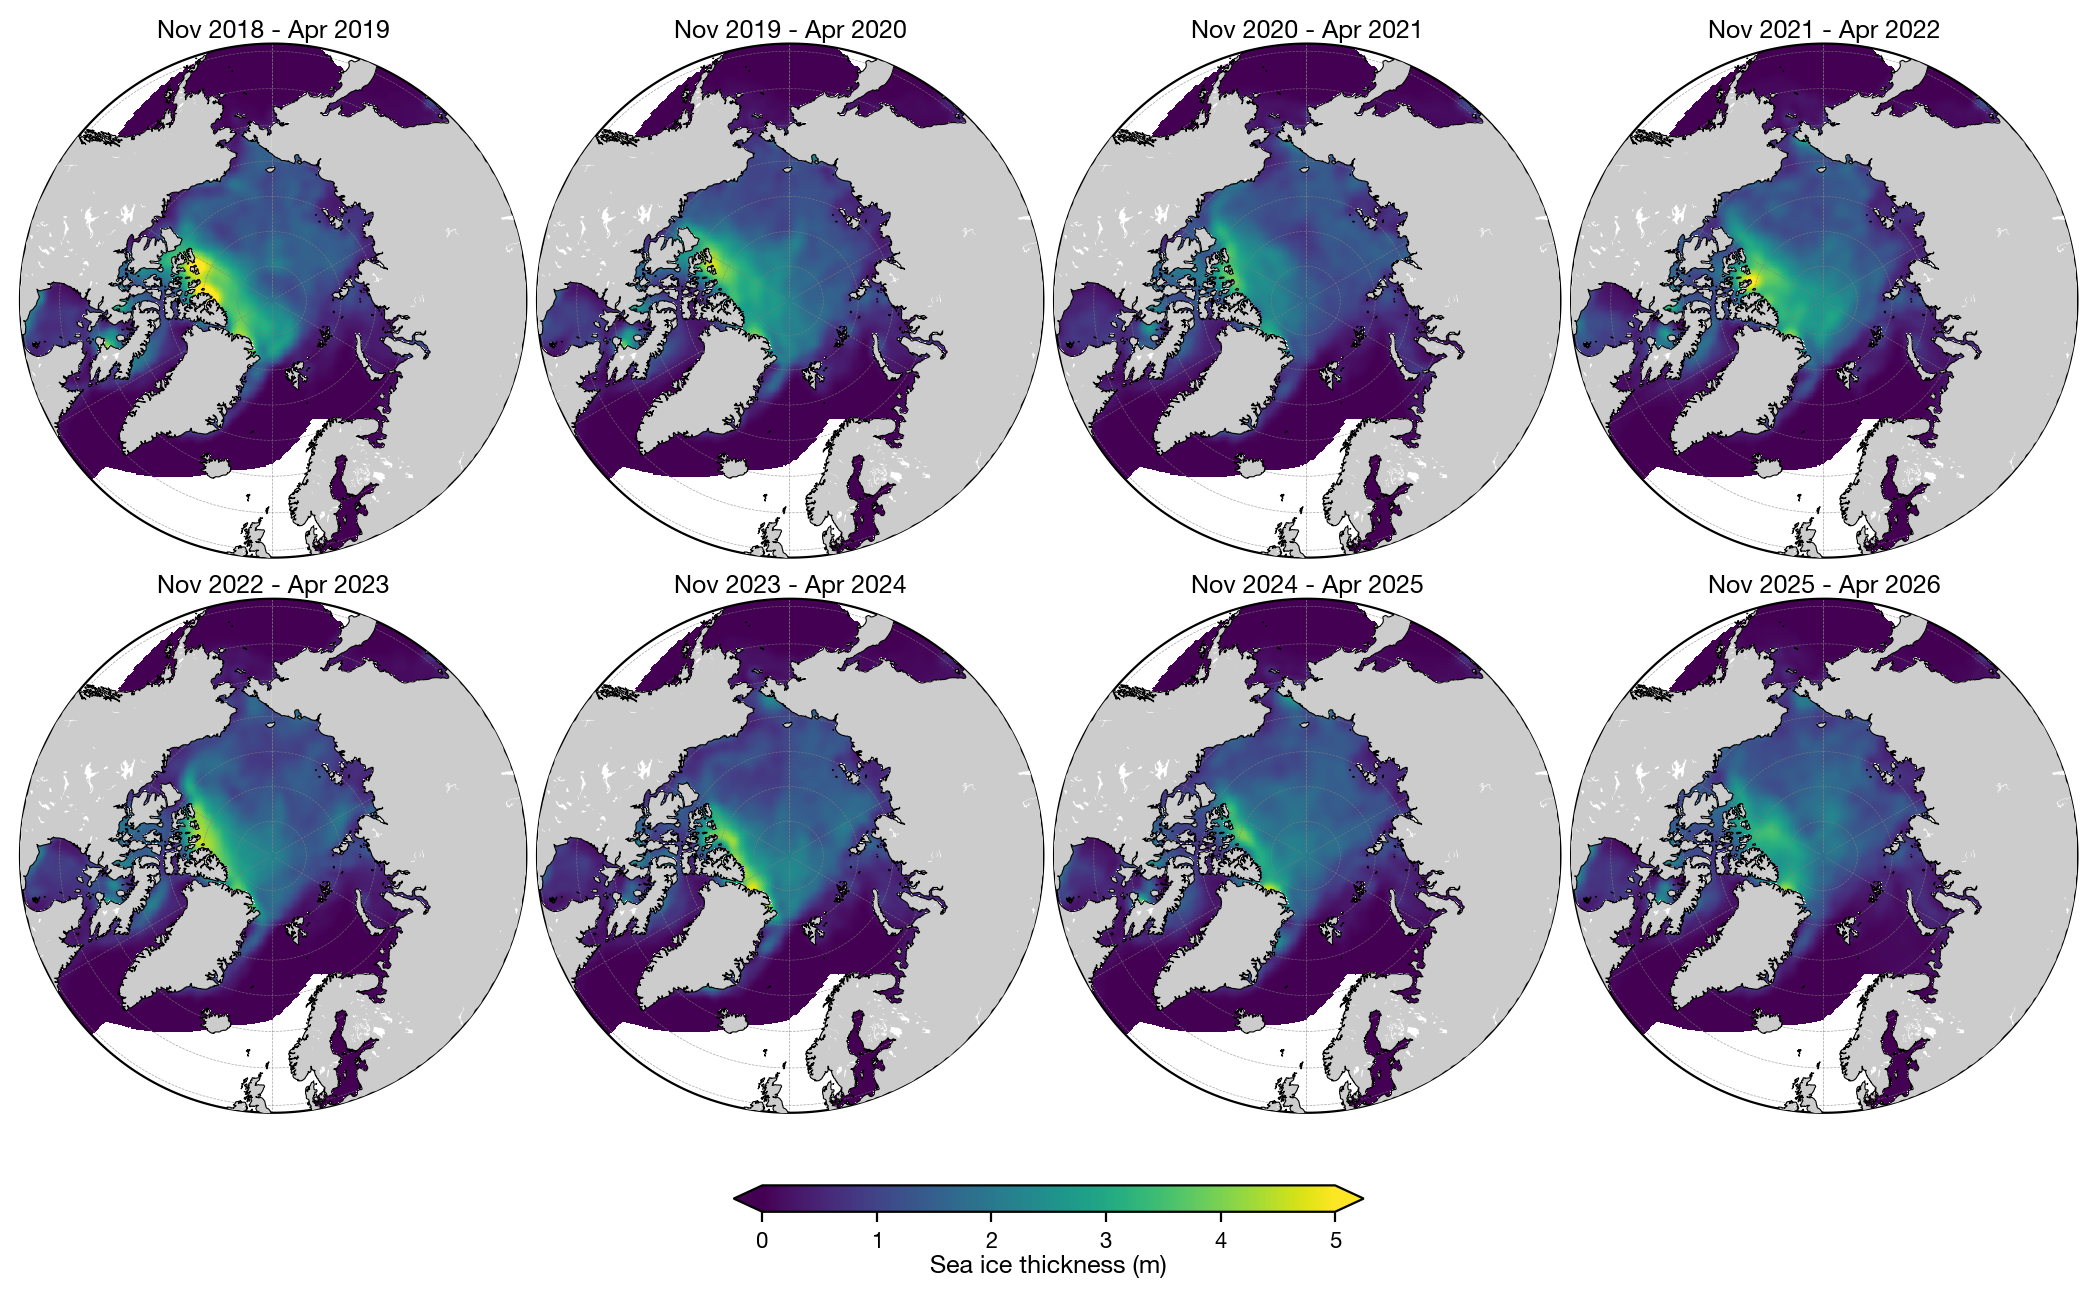
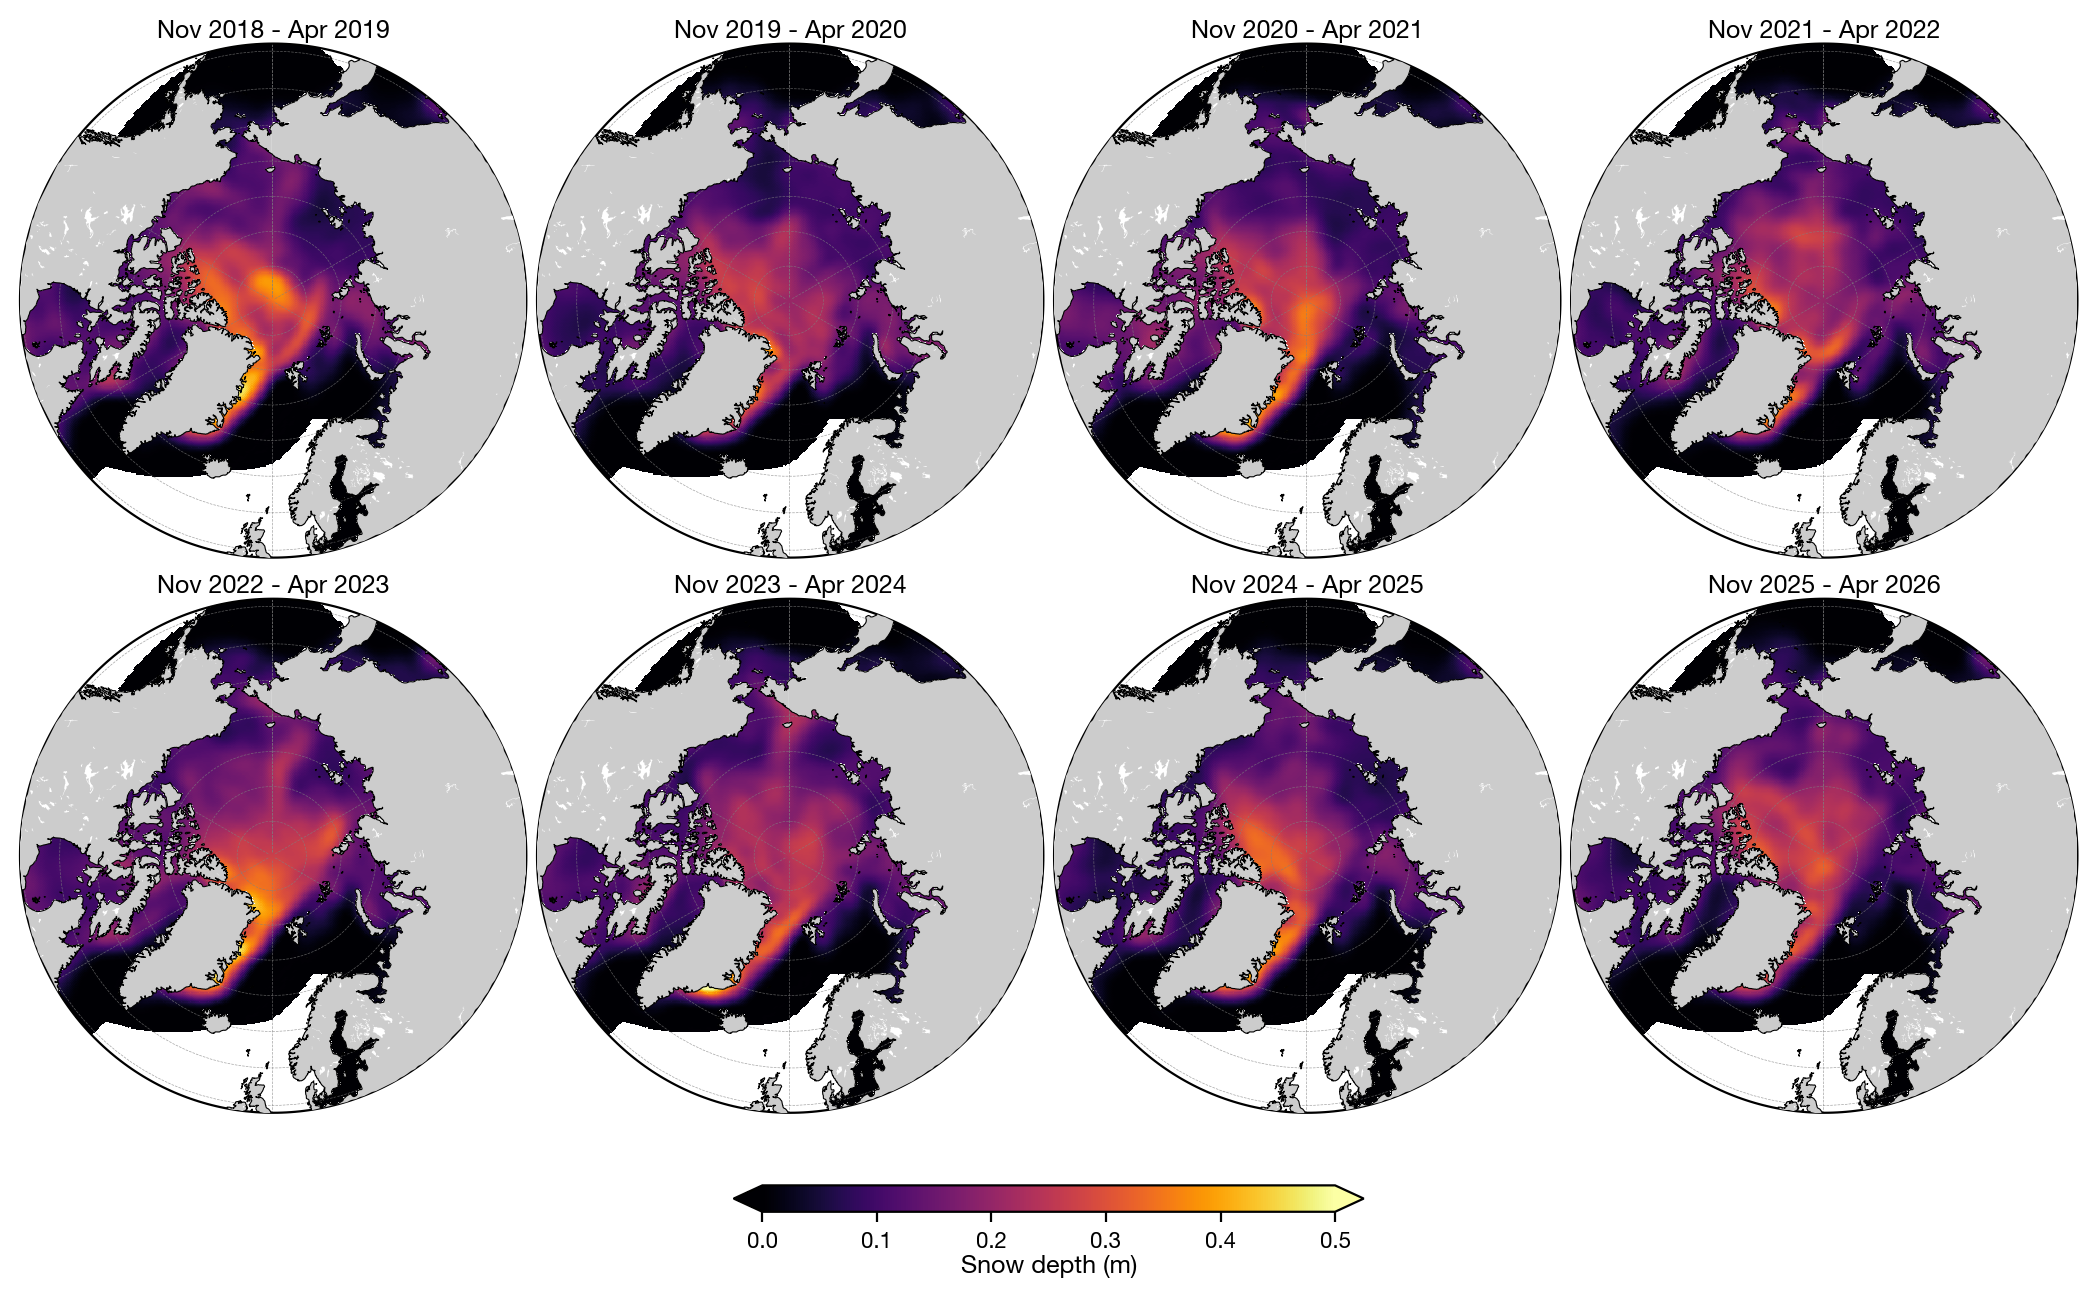
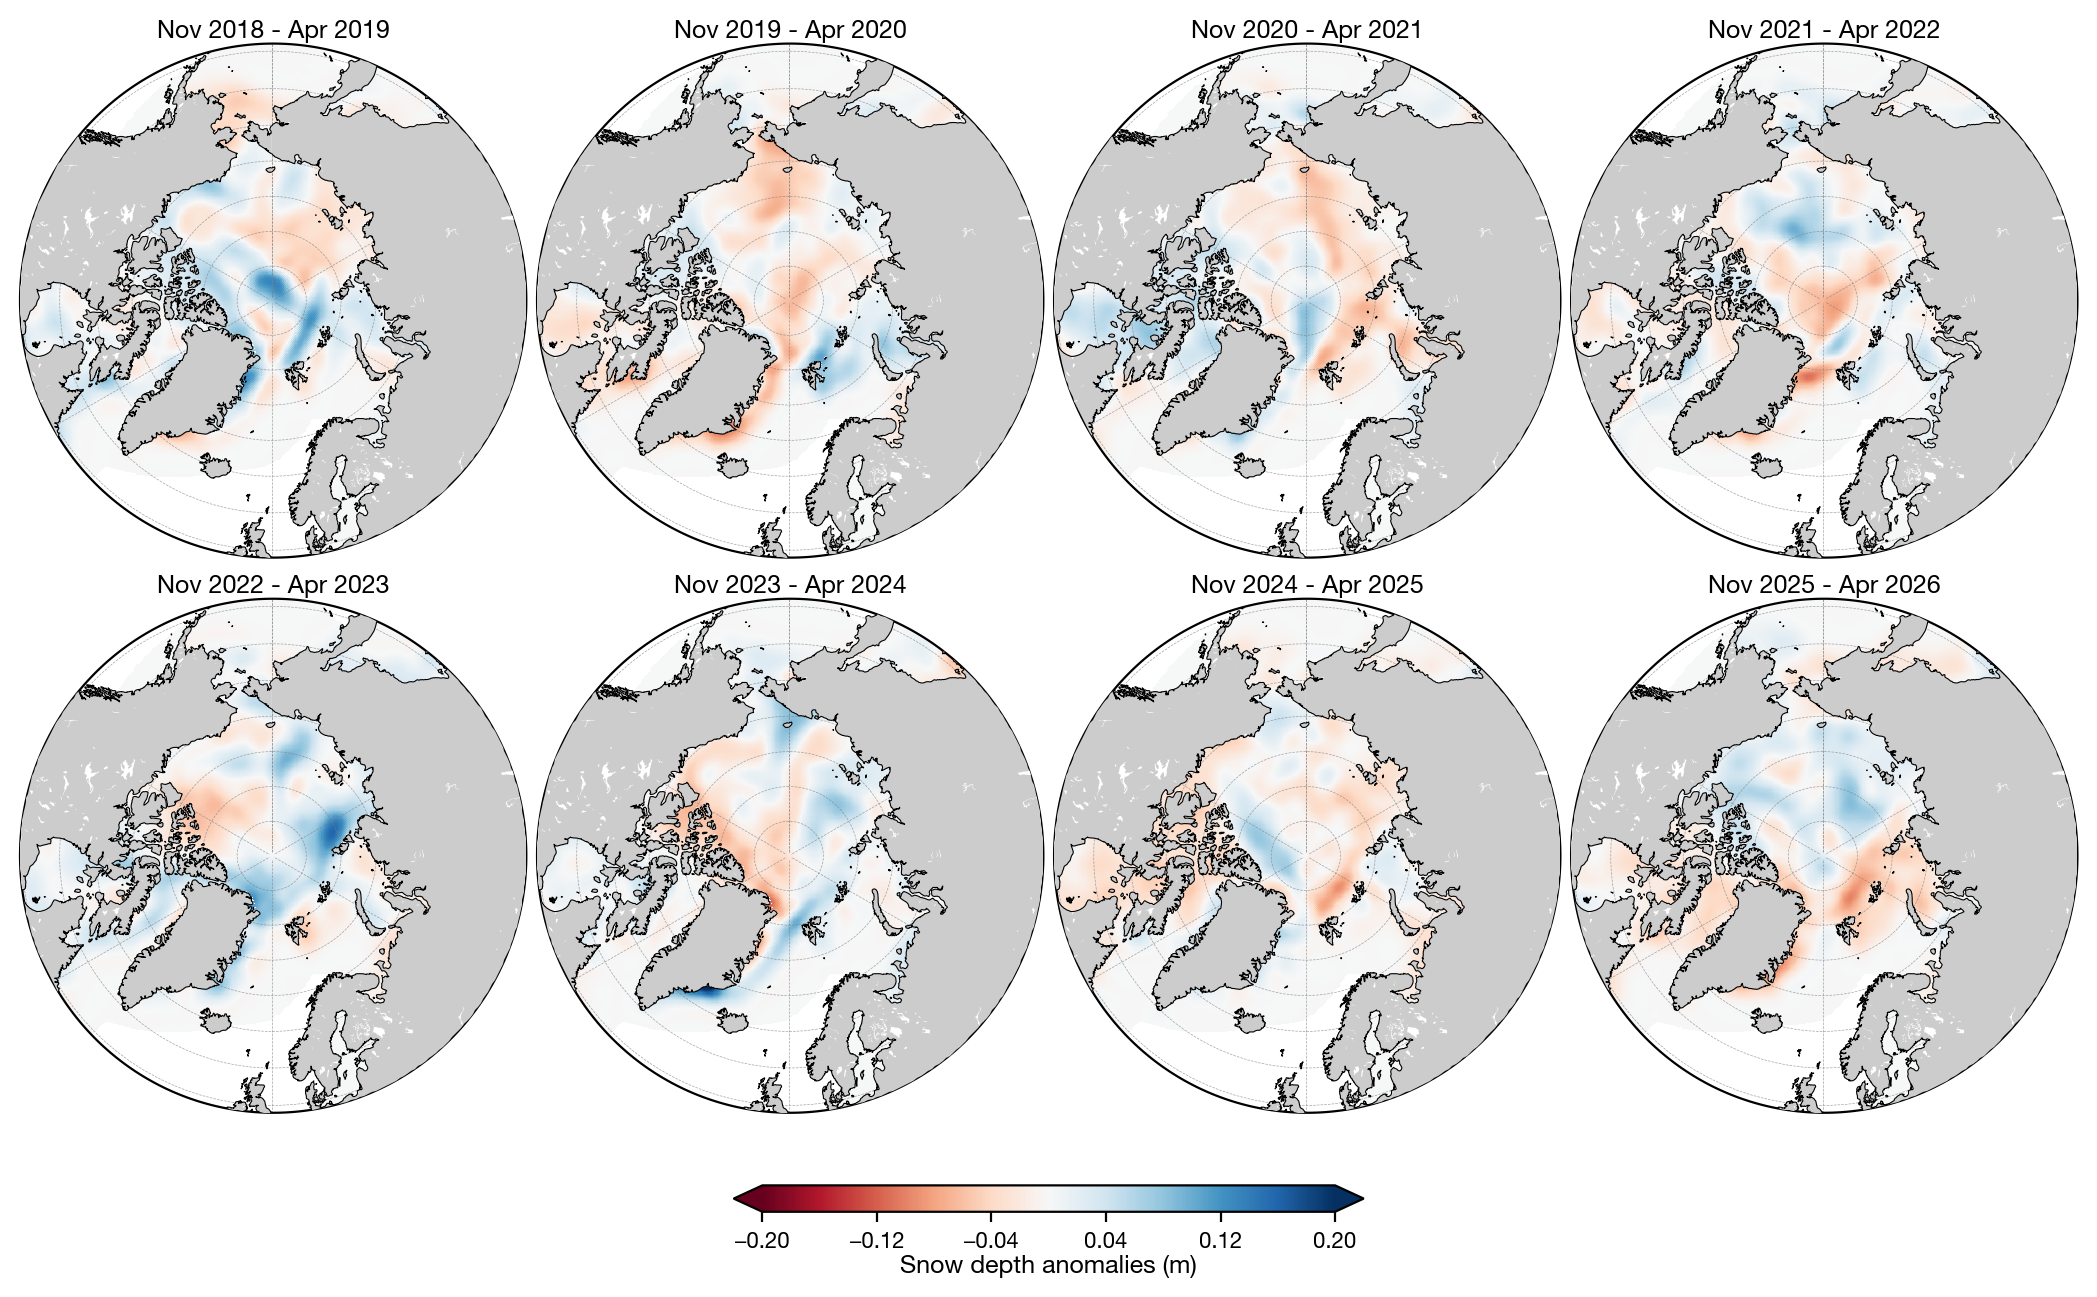
Compute November–April grid-cell means for winters starting 2018 through 2025 (eight growth seasons, through April 2026). Absolute fields and anomalies use the same staticArcticMaps_equal_panels layout as notebook 11e.
# Years over which to perform analysis (start year of that winter period)
years = [x for x in range(2018, 2025 + 1)]

freeboard_winter_means = compute_gridcell_winter_means(IS2_monthly.freeboard, years=years)
snow_depth_winter_means = compute_gridcell_winter_means(IS2_monthly.snow_depth, years=years)
thickness_winter_means = compute_gridcell_winter_means(IS2_monthly.ice_thickness, years=years)

# Open-water / missing *ocean* cells are NaN; set those to 0 for mapping.
# Leave land (region_mask outside 1–18) as NaN so Natural Earth land can overlay cleanly.
_rm = IS2_SMOS_SMAP['region_mask']
if 'time' in _rm.dims:
    _rm = _rm.isel(time=0, drop=True)
_ocean = _rm.isin(list(range(1, 19))).compute()

def _fill_open_water(da):
    return da.fillna(0).where(_ocean)

freeboard_winter_means = _fill_open_water(freeboard_winter_means)
snow_depth_winter_means = _fill_open_water(snow_depth_winter_means)
thickness_winter_means = _fill_open_water(thickness_winter_means)

print('winters:', list(thickness_winter_means.time.values))
print('thickness winter means shape:', thickness_winter_means.shape)
winters: ['Nov 2018 - Apr 2019', 'Nov 2019 - Apr 2020', 'Nov 2020 - Apr 2021', 'Nov 2021 - Apr 2022', 'Nov 2022 - Apr 2023', 'Nov 2023 - Apr 2024', 'Nov 2024 - Apr 2025', 'Nov 2025 - Apr 2026']
thickness winter means shape: (8, 448, 304)
staticArcticMaps_equal_panels(
    freeboard_winter_means,
    dates=freeboard_winter_means.time.values,
    title="",
    set_cbarlabel="Freeboard (m)",
    cmap="YlOrRd",
    vmin=0,
    vmax=0.8,
    out_str='freeboard_winter_2018_2026_is2smgpsitv1',
    ocean_mask=_ocean.values,
)
staticArcticMaps_equal_panels(
    freeboard_winter_means - freeboard_winter_means.mean("time"),
    dates=freeboard_winter_means.time.values,
    title="",
    set_cbarlabel="Freeboard anomalies (m)",
    cmap="RdBu",
    vmin=-0.2,
    vmax=0.2,
    out_str='freeboard_winter_2018_2026_anoms_is2smgpsitv1',
    ocean_mask=_ocean.values,
)
staticArcticMaps_equal_panels(
    thickness_winter_means,
    dates=thickness_winter_means.time.values,
    title="",
    set_cbarlabel="Sea ice thickness (m)",
    cmap="viridis",
    vmin=0,
    vmax=5,
    out_str='thickness_winter_2018_2026_is2smgpsitv1',
    ocean_mask=_ocean.values,
)
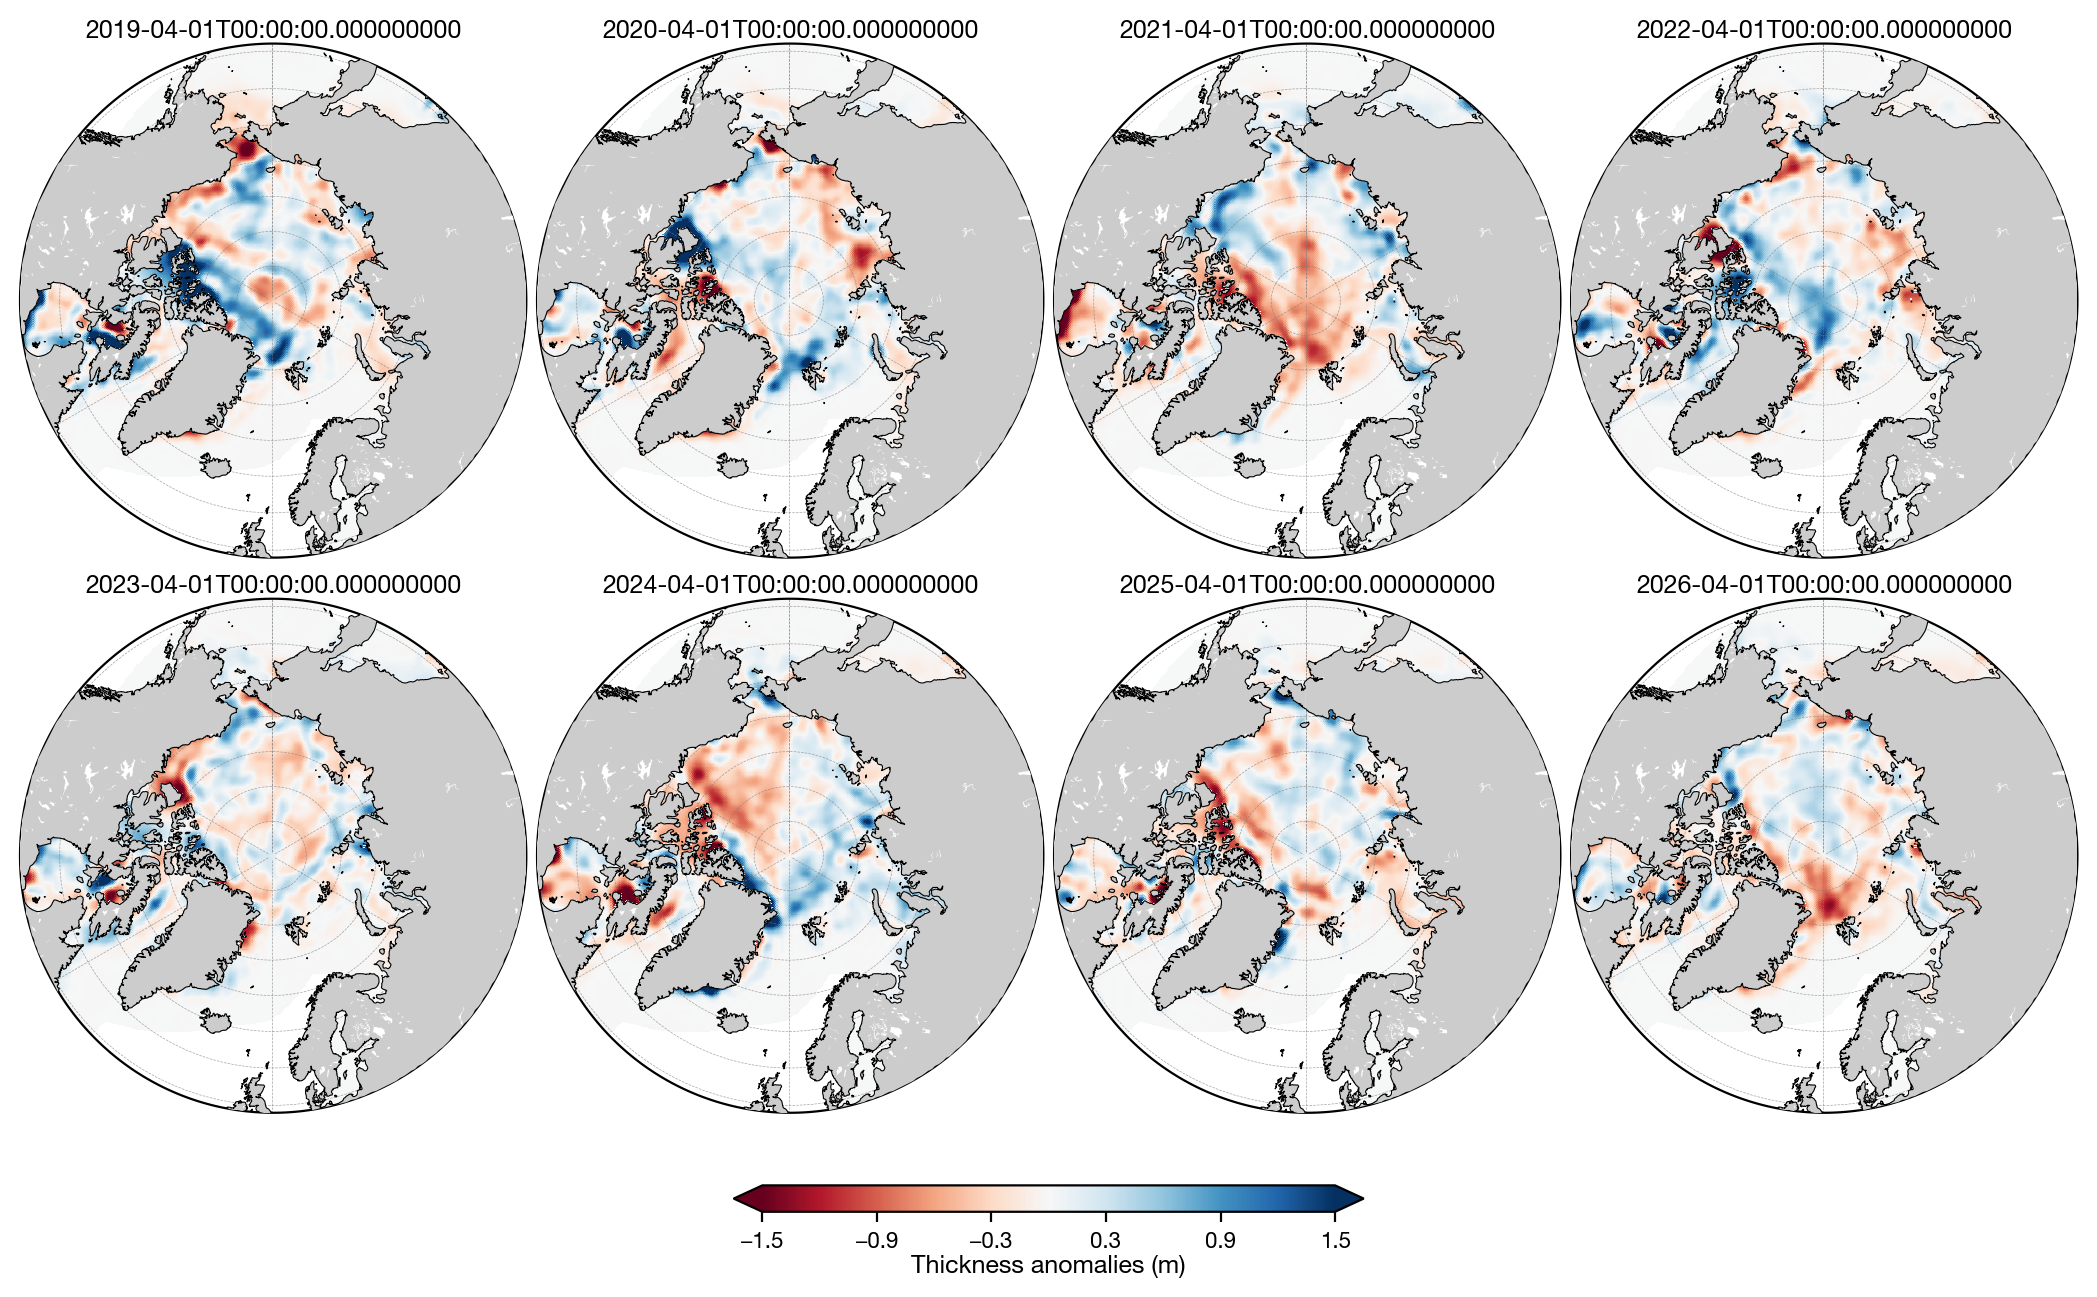
# April-only thickness anomalies
mask = IS2_monthly.time.dt.month == 4
april_thickness = _fill_open_water(IS2_monthly.ice_thickness.sel(time=mask))
april_anom = _fill_open_water(april_thickness - april_thickness.mean('time'))
print('April anomaly times:', list(pd.to_datetime(april_anom.time.values)))
staticArcticMaps_equal_panels(
    april_anom,
    dates=april_anom.time.values,
    title="",
    set_cbarlabel="Thickness anomalies (m)",
    cmap="RdBu",
    vmin=-1.5,
    vmax=1.5,
    out_str='thickness_april_2019_2026_anomalies_is2smgpsitv1',
    ocean_mask=_ocean.values,
)
April anomaly times: [Timestamp('2019-04-01 00:00:00'), Timestamp('2020-04-01 00:00:00'), Timestamp('2021-04-01 00:00:00'), Timestamp('2022-04-01 00:00:00'), Timestamp('2023-04-01 00:00:00'), Timestamp('2024-04-01 00:00:00'), Timestamp('2025-04-01 00:00:00'), Timestamp('2026-04-01 00:00:00')]
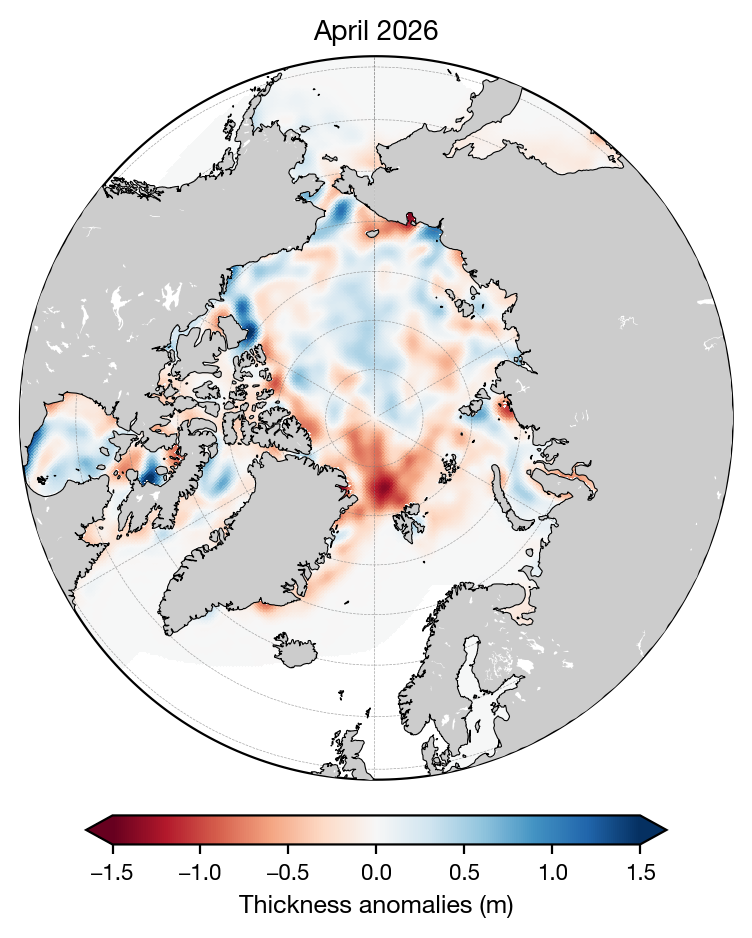
April 2026 thickness anomaly#
Single-panel map of April 2026 thickness minus the eight-April mean, using the same color scale and land/ocean treatment as the multi-winter April anomaly figure.
april_2026 = april_anom.sel(time='2026-04-01', method='nearest')
print('April 2026 anomaly time:', april_2026.time.values)

_nsidc_globe = ccrs.Globe(semimajor_axis=6378273, semiminor_axis=6356889.449)
data_crs = ccrs.Stereographic(
    central_latitude=90, central_longitude=-45, true_scale_latitude=70,
    globe=_nsidc_globe,
)
map_crs = ccrs.NorthPolarStereo(central_longitude=0)

data = np.asarray(april_2026.values, dtype=float)
ocean = np.asarray(_ocean.values).astype(bool)
data = np.where(ocean, data, np.nan)
plot_cmap = mcm.get_cmap('RdBu').copy()
plot_cmap.set_bad('white')

fig = plt.figure(figsize=(5.2, 5.8))
ax = fig.add_subplot(1, 1, 1, projection=map_crs)
ax.set_facecolor('white')
im = ax.pcolormesh(
    april_2026['x'].values, april_2026['y'].values, np.ma.masked_invalid(data),
    transform=data_crs, shading='nearest', cmap=plot_cmap, vmin=-1.5, vmax=1.5, zorder=1,
)
ax.set_extent([-179, 179, 54, 90], crs=ccrs.PlateCarree())
theta = np.linspace(0, 2 * np.pi, 361)
verts = np.vstack([np.sin(theta), np.cos(theta)]).T
ax.set_boundary(mpath.Path(verts * 0.5 + 0.5), transform=ax.transAxes)
ax.set_facecolor('white')
ax.gridlines(draw_labels=False, linewidth=0.25, color='gray', alpha=0.7, linestyle='--', zorder=2)
ax.add_feature(cfeature.LAND.with_scale('50m'), facecolor='0.80', edgecolor='none', zorder=10)
ax.add_feature(cfeature.LAKES.with_scale('50m'), facecolor='white', edgecolor='none', zorder=11)
ax.coastlines(resolution='50m', linewidth=0.4, color='black', zorder=12)
ax.set_title('April 2026', fontsize=10, fontweight='medium')
cbar = fig.colorbar(im, ax=ax, orientation='horizontal', pad=0.04, shrink=0.72, extend='both')
cbar.set_label('Thickness anomalies (m)', fontsize=9)
fig.savefig(
    './figs/maps_thickness_april_2026_anomaly_is2smgpsitv1.png',
    dpi=300, facecolor='white', bbox_inches='tight',
)
plt.show()
April 2026 anomaly time: 2026-04-01T00:00:00.000000000
staticArcticMaps_equal_panels(
    snow_depth_winter_means,
    dates=snow_depth_winter_means.time.values,
    title="",
    set_cbarlabel="Snow depth (m)",
    cmap="inferno",
    vmin=0,
    vmax=0.5,
    out_str='snow_depth_winter_2018_2026_is2smgpsitv1',
    ocean_mask=_ocean.values,
)
staticArcticMaps_equal_panels(
    snow_depth_winter_means - snow_depth_winter_means.mean("time"),
    dates=snow_depth_winter_means.time.values,
    title="",
    set_cbarlabel="Snow depth anomalies (m)",
    cmap="RdBu",
    vmin=-0.2,
    vmax=0.2,
    out_str='snow_depth_winter_2018_2026_anoms_is2smgpsitv1',
    ocean_mask=_ocean.values,
)
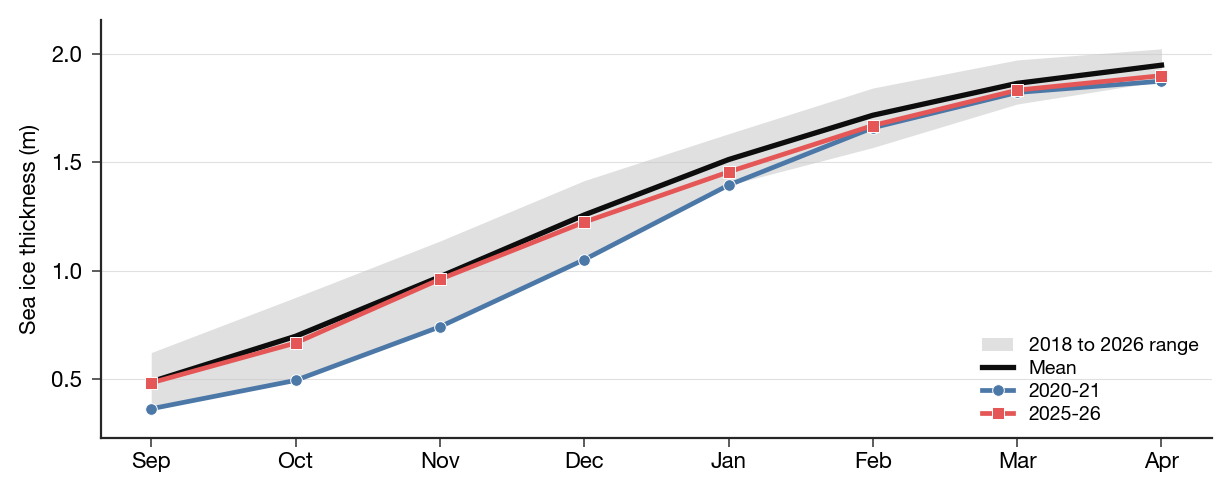
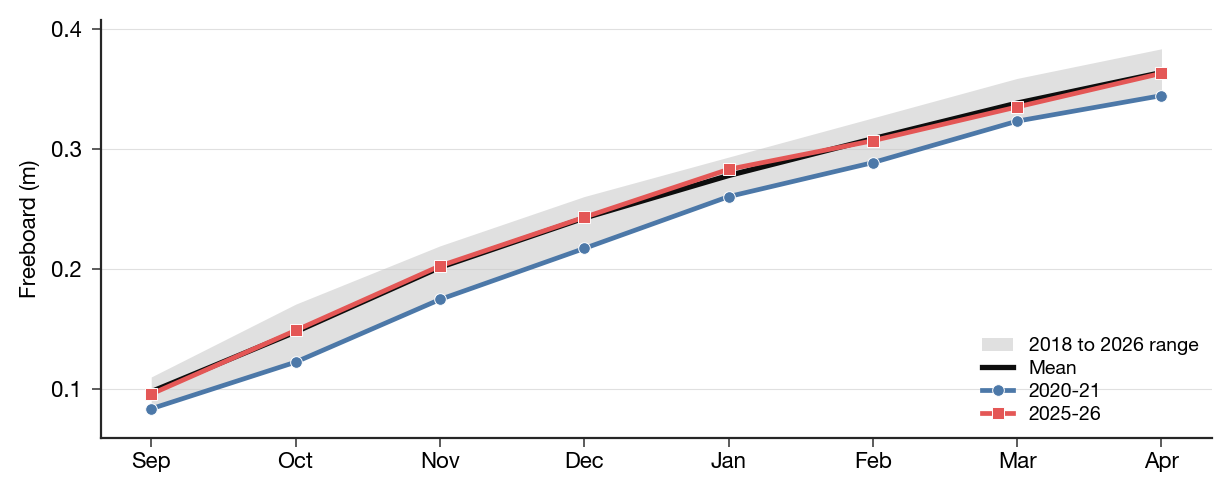
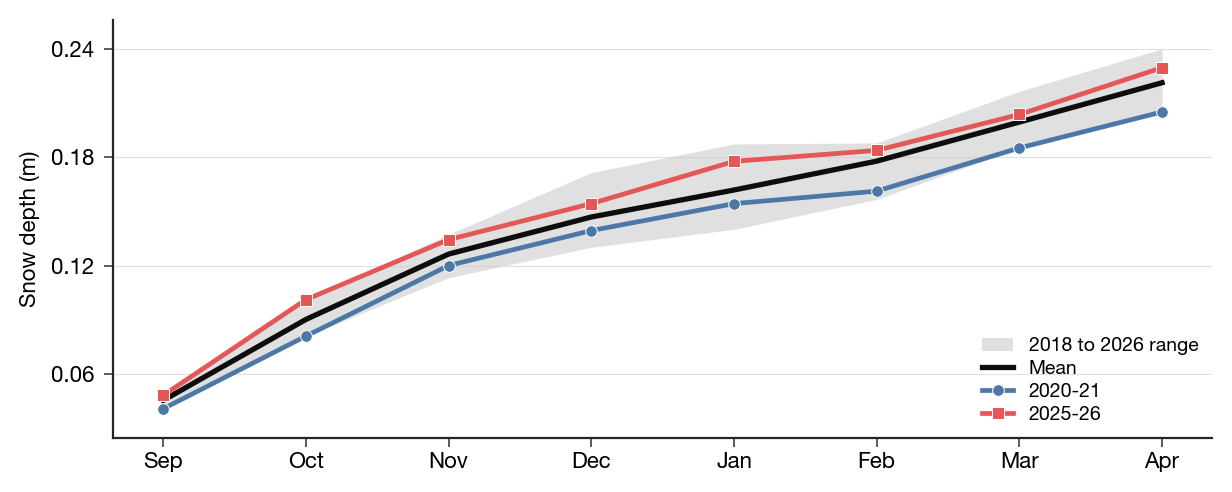
Inner-Arctic seasonal cycles#
Inner Arctic Ocean (NSIDC regions 1–5) monthly means, including the new 2025–2026 winter.
innerArctic = [1, 2, 3, 4, 5]
IS2_innerArctic = IS2_monthly.where(_rm.isin(innerArctic))

# Envelope = all-winter range; black mean; 2020–21 and latest winter as lines.
static_winter_comparison_lineplot(
    IS2_innerArctic.ice_thickness, years=years, start_month="Sep",
    figsize=(6.2, 2.5), set_ylabel='Sea ice thickness',
    set_units='m', loc_pos=4, envelope=True, save_label='is2smgpsitv1_2026',
)
static_winter_comparison_lineplot(
    IS2_innerArctic.freeboard, years=years, start_month="Sep",
    figsize=(6.2, 2.5), set_ylabel='Freeboard',
    set_units='m', loc_pos=4, envelope=True, save_label='is2smgpsitv1_2026',
)
static_winter_comparison_lineplot(
    IS2_innerArctic.snow_depth, years=years, start_month="Sep",
    figsize=(6.2, 2.5), set_ylabel='Snow depth',
    set_units='m', loc_pos=4, envelope=True, save_label='is2smgpsitv1_2026',
)
Notes#
Winter means use November–April (same default as
compute_gridcell_winter_means/ notebooks2fand11e).Daily fields are first averaged to calendar months, then those monthly fields are averaged over each winter.
The 2025–2026 season is read from
s3://icesat-2-sea-ice-us-west-2/is2smsitgp/dev_v7_26/zarr/GPSat_multivar_20250901-20260430.zarrand concatenated with the v0.1 store (November 2018–April 2025).Figures are written to
./figs/maps_<out_str>.pngwith an_is2smgpsitv1suffix.Anomalies are relative to the eight-winter mean.
Open-water NaNs in ocean cells (NSIDC region_mask 1–18) are filled with 0 so they take the colormap zero color; land/coast cells stay NaN and are painted grey via
ocean_mask.Seasonal cycles show the min–max winter range as shading, the multi-winter mean (black), and labeled lines for 2020–21 and the most recent winter.
Stand-alone April 2026 anomaly:
./figs/maps_thickness_april_2026_anomaly_is2smgpsitv1.png.