ICESat-2 Arctic Sea Ice State Analysis#
Overview#
NASA’s Ice, Cloud, and Land Elevation Satellite-2 (ICESat-2) is an advanced satellite laser altimetry system designed to profile Earth’s polar regions with meter-scale horizontal resolution and centimeter-scale vertical precision, making it particularly well-suited for profiling Arctic sea ice thickness. This Jupyter Book provides a comprehensive analysis of Arctic sea ice thickness variability derived from ICESat-2 since its launch in fall 2018. The initial focus of this book was on winter Arctic sea ice thickness, but we have recently expanded this to include summer/all-season gridded thickness estimates.
Contributors#
Alek Petty (Current book lead, summer 2022 onwards)
Nicole Keeney (Original book creator)
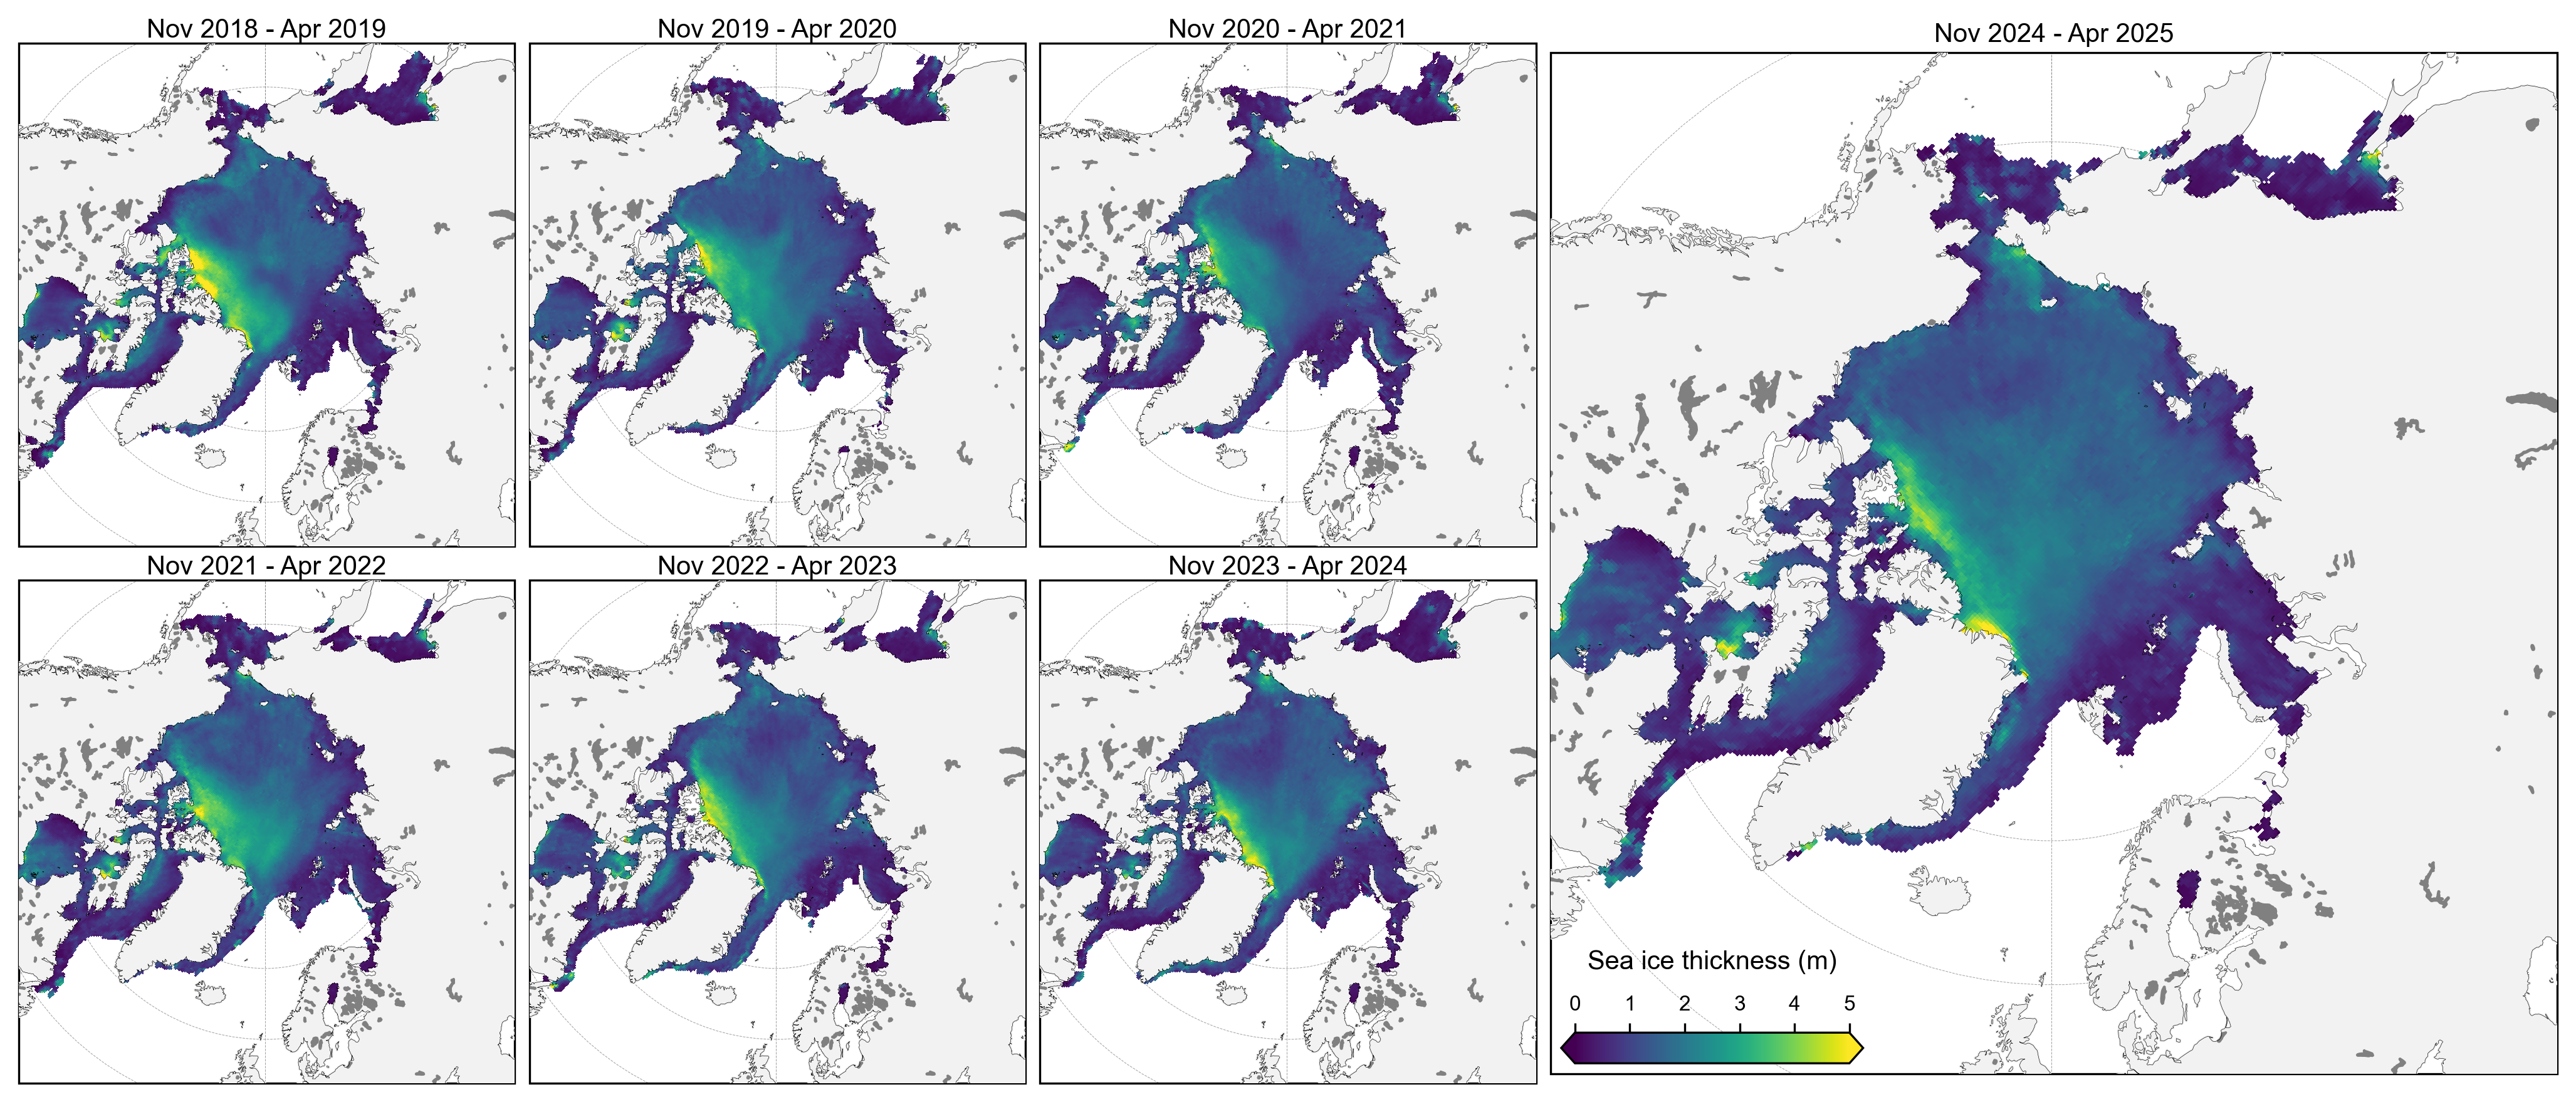
Fig 1: Mean winter (November to April) Arctic sea ice thickness from the first seven winters profiled by ICESat-2 (data from the monthly gridded IS2SITMOGR4 dataset).
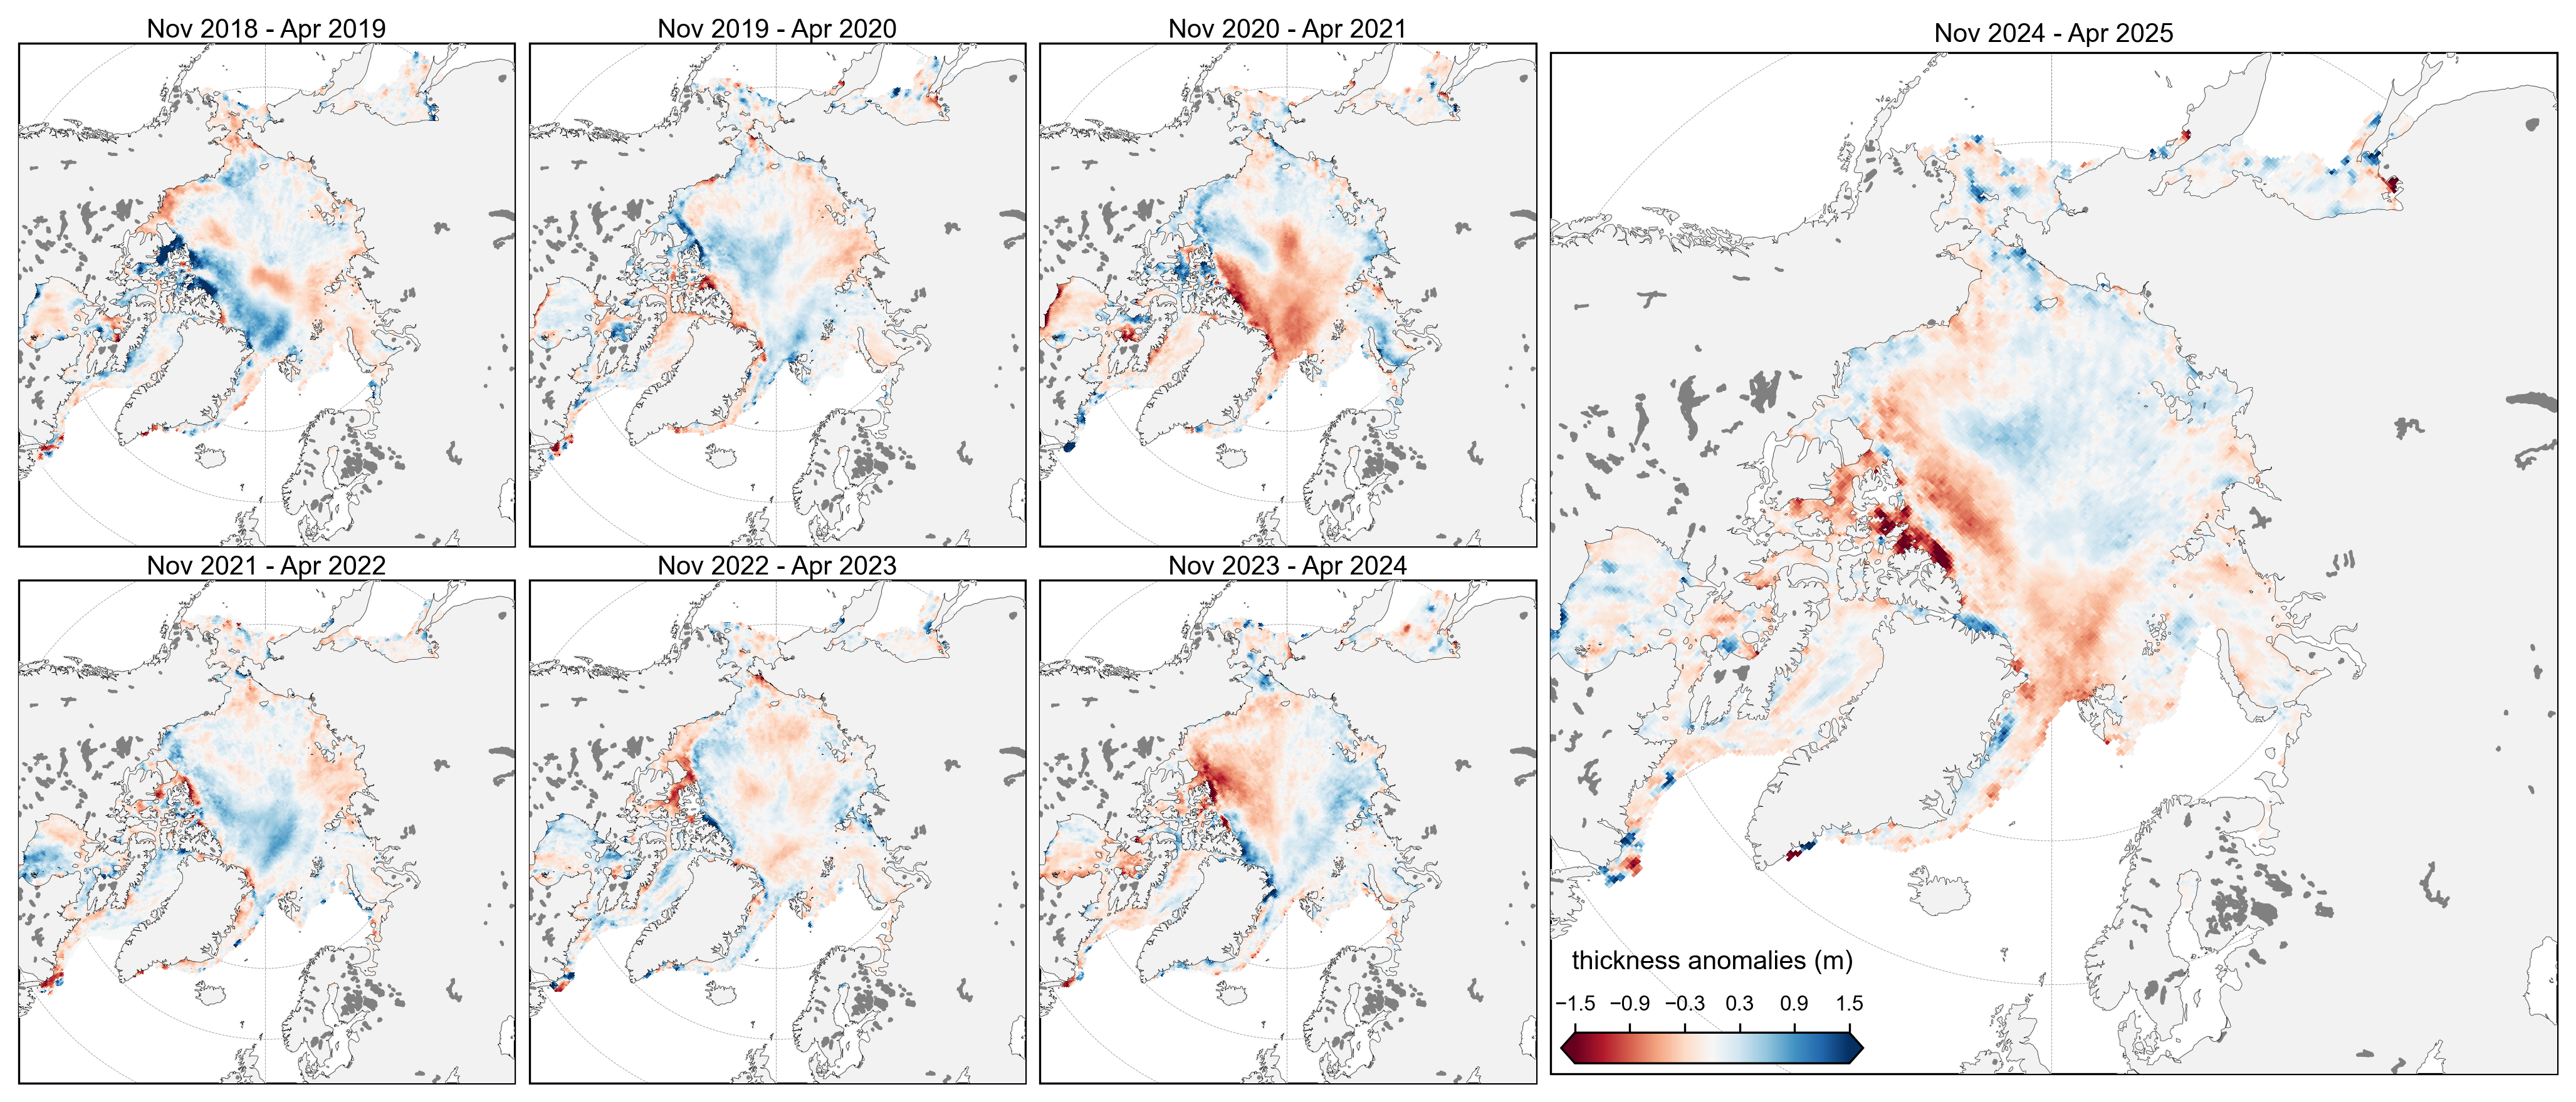
Fig 2: Mean winter (November to April) Arctic sea ice thickness anomalies (relative to the seven winter mean) from the first seven winters profiled by ICESat-2.
Version History#
Version 1.6 (11/15/2025):
Added a new winter 2024-2025 notebook
Version 1.5 (10/01/2025):
Finalized the all-season notebooks following peer review.
Added UV package manager environment support (see the GitHub README).
Version 1.4 (05/20/2025):
Added new preliminary all-season chapter
Added all-season data wrangling notebook and dataset
Version 1.3 (02/14/2025):
Added 2023-2024 winter analysis notebook
Updated read_IS2SITMOGR4 function with new zarr path for V3 data up to 2024
Version 1.2 (11/27/2023):
Added 2022-2023 winter analysis notebook
Described new Version 3 IS2SITMOGR4 dataset
Minor bug fixes
Version 1.1 (01/27/2023):
Added 2021-2022 winter analysis notebook
Minor bug fixes
Version 1.0 (12/23/2023):
First full release associated with TC paper (Petty et al., 2023)
Archived on Zenodo: https://zenodo.org/record/7474218
Jupyter Book description#
Jupyter Books provide a novel means of compiling various related Jupyter Notebooks into one convenient and well-indexed location. Here, a series of Jupyter Notebooks are used to provide a visual demonstration of our efforts to analyze winter Arctic sea ice conditions, primiarly freeboard and thickness, derived from ICESat-2 data, along with other relevant datasets.
Using the book#
There are three different ways to use this Jupyter Book:
View the rendered Jupyter Notebooks by clicking through the links on the left. Note that there is no interactivity with this option.
Run the Notebooks interactively in Binder. Just click the Binder tab under the rocket ship icon at the top of each Notebook. This option is configured for all notebooks except the modules in the Helper Functions section and the Data Wrangling notebook.
Clone (or fork then clone) the GitHub repository and run the Jupyter Notebooks locally. Just click the repository tab under the GitHub icon at the top of this page.
Data Products#
The ICESat-2 Project Science Office has produced several official data products through the National Snow and Ice Data Center (NSIDC) used in these notebooks:
ATL10: along-track Arctic and Southern Ocean total freeboard for all six beams of ICESat-2, key input to the monthly gridded thickness data.
IS2SITMOGR4: Monthly gridded winter (September to April) Arctic sea ice thickness estimates using snow loading from the NASA Eulerian Snow on Sea Ice Model (NESOSIM). For detailed methodology see our original methodology paper and the updated analysis.
In addition, we have archived a preliminary/unofficial summer (May to August) monthly gridded Arctic sea ice thickness dataset, IS2SITMOGR4S.
Additional ICESat-2 sea ice datasets not used here include the official along-track height/type product (ATL07), along-track winter Arctic sea ice thickness estimates (IS2SITDAT4) and monthly gridded total freeboard (ATL20) and sea surface height anomalies (ATL21).
Accessing the data#
The monthly gridded ICESat-2 winter Arctic sea ice thickness data are archived and made publicly available at the NSIDC (https://nsidc.org/data/IS2SITMOGR4). However, to simplify our analysis we have also uploaded these same data to an AWS S3 Bucket as both netcdfs and zarr (see associated data readers in the notebooks).
In this first release of this Jupyter Book we also generated and uploaded aggregated netcdf files containing all the data needed for the original analysis in an S3 bucket under the name IS2_jbook_dataset_201811-202104.nc and IS2_CS2_jbook_dataset_201811-202104.nc. These datasets contains all the gridded ICESat-2 sea ice thickness data along with all other datasets used in the notebook to help contextualize the sea ice and atmospheric conditions through each winter.
To support the new all-season analysis we have also produced a wrangled all-season aggregated netcdf file.
All datasets included have been regridded to the same NSIDC North Polar Stereographic grid (the native grid of the ICESat-2 sea ice data used), to simplify the mapping and comparisons. See the Data Wrangling pages for more information each dataset and on on the regridding process.
References#
Petty, A. A., A. Cabaj, J. Landy, Initial assessment of all-season Arctic sea ice thickness from ICESat-2, submitted to Journal of Glaciology (preprint hosted on EarthArXiv).
Druckenmiller, M. L., Thoman, R., and T. Moon, Eds., (2024) The Arctic [in “State of the Climate in 2023”]. Bull. Amer. Meteor. Soc., 105 (8), S277–S330, doi: 10.1175/BAMS-D-24-0101.1.
Meier, W., A. Petty, S. Hendricks, et al., (2024), “Sea Ice”, NOAA Arctic Report Card 2024, T. A. Moon, M. L. Druckenmiller, and R. L. Thoman, Eds, doi: 10.25923/aksk-7p66.
Meier, W., A. Petty, S. Hendricks, et al., (2023), “Sea Ice”, NOAA Arctic Report Card 2023, T. A. Moon, M. L. Druckenmiller, and R. L. Thoman, Eds, doi: 10.25923/f5t4-b865.
Petty A. A., N. Keeney, A. Cabaj, P. Kushner, M. Bagnardi (2023), Winter Arctic sea ice thickness from ICESat-2: upgrades to freeboard and snow loading estimates and an assessment of the first three winters of data collection, The Cryosphere, 17, 127–156, doi: 10.5194/tc-17-127-2023
Petty, A. A., N. T. Kurtz, R. Kwok, T. Markus, T. A. Neumann (2020), Winter Arctic sea ice thickness from ICESat‐2 freeboards, Journal of Geophysical Research: Oceans, 125, e2019JC015764. doi:10.1029/2019JC015764
Thoman, R., M. L. Druckenmiller, and T. Moon,, Eds., (2023) The Arctic [in “State of the Climate in 2022”]. Bull. Amer. Meteor. Soc., 104 (9), S271–S321, doi: 10.1175/BAMS-D-23-0079.1
Packages#
All of the notebooks in this notebook utilize xarray, a python package built for working with multi-dimensional data like the monthly gridded sea ice data. Xarray is especially useful for time series data and allows for easily plotting data on map projections via compatability with the python packages cartopy and hvplot.
License#
All content in this Jupyter Book is distributed under the MIT license.